Min or max, that is the question
So, for the past 8 years or so I’ve been having small pool betting web site for me and my friends – nothing fancy, around 50 people at most, and we bet only on final result (1, X, 2). Number of points you get is equal to decimal odd of your bet (so, if you play odd with value of 1.61 (or 8/13 in fractional), you get 1.61 points). It is the same as playing singles with 1€ stake on each game. Whoever has the highest number of points, wins! So, I fire up this site every 2 year – either for World Cup or for Euro cup. I am writing this right after the Euro 2016 finals and we have our new winner:) (and as you probably guessed correctly, he won mostly because he placed a lot of bets on Island and that brought him a lot of points:). So, question I got a lot since this pool betting is alive, and especially during competitions is:
If I play only minimum (or maximum) odds throughout whole competition, will I be the first one?
Short answer, for those who don’t want to read too much is – unfortunately no. Playing small odds will definitively minimize your risk, but will not get you profit. Playing only maximum odds will also not get you far; of course, depending how weird competition was. Actually, not only that both of these will not get you to be top 1 in my pool bet, but it will not even get you to be positive if you played it for real! So, let’s look at Euro2016. If you played only minimum odds, you would get 36.94 points (sum of all winning odds). To put this into perspective, if you gave 1€ for every match and there was 63 matches total, you would get back only 36.94€, so you would lose more than 26€. Definitively not a way to go. Let’s look what would happen if you would play only maximum odds – you would be far better – you would get back 56.35 (€ or points). So, you would end up in positive profit, e.g. earn money! I did same analysis for World Cup 2014 and all results are in the table below:
| Competition | Games | Odds playing | Points | Profit | Hypothetical place in my pool bet |
|---|---|---|---|---|---|
| World Cup 2014 | 64 | Min | 67.05 | +3.05€ | 16/68 |
| World Cup 2014 | 64 | Max | 38.35 | -25.65€ | 64/68 |
| Euro 2016 | 51 | Min | 36.94 | -14.06€ | 56/70 |
| Euro 2016 | 51 | Max | 56.35 | +5.35€ | 16/70 |
As you can see, on World Cup, it was far better playing minimal odds, while on Euro2016, it was better playing high ones. I guess it can be explained as Euro2016 was far more volatile than World Cup 2014. Here, you had so many surprises – Island, Wales, Hungary, even Albania in first round. Looking at World Cup 2014, I cannot think of any outsider beating the odds except Costa Rica, if you remember. All in all, I would say that:
- Playing only minimal/maximal odds will not make your profit positive
- If you know somehow in advance whether competition is going to be volatile or not, you could minimize your risk
Then what, if not min or max?
So, we are constraining ourselves if we say we want to pursue only minimum or maximum values. What about X (draw) which is usually somewhere in between. How can we create algorithm to tell us should we play X (and not min/max on favorite or outsider team)? Or does value for X matters? Maybe we should pursue only odds around certain values?
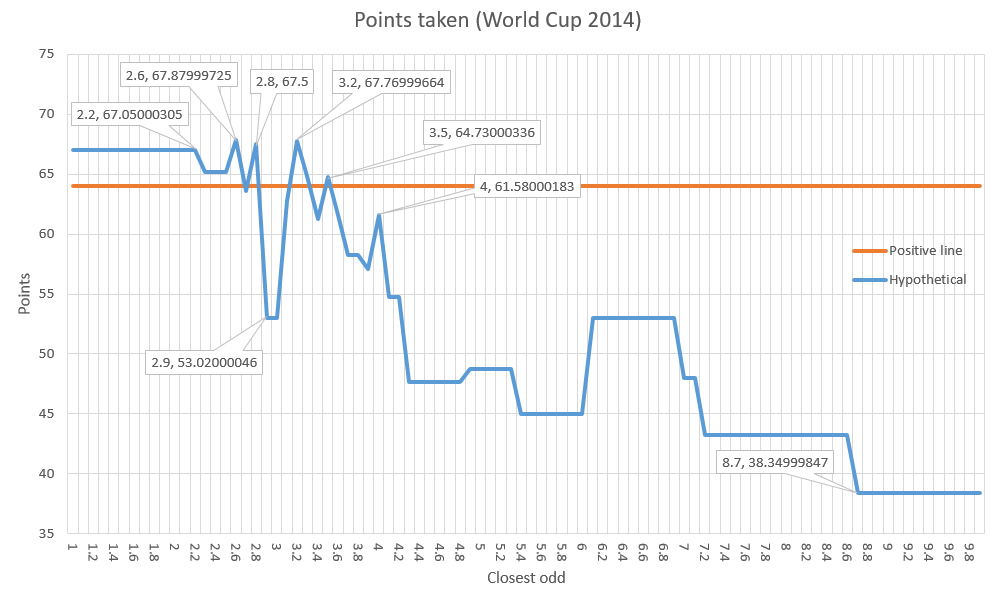
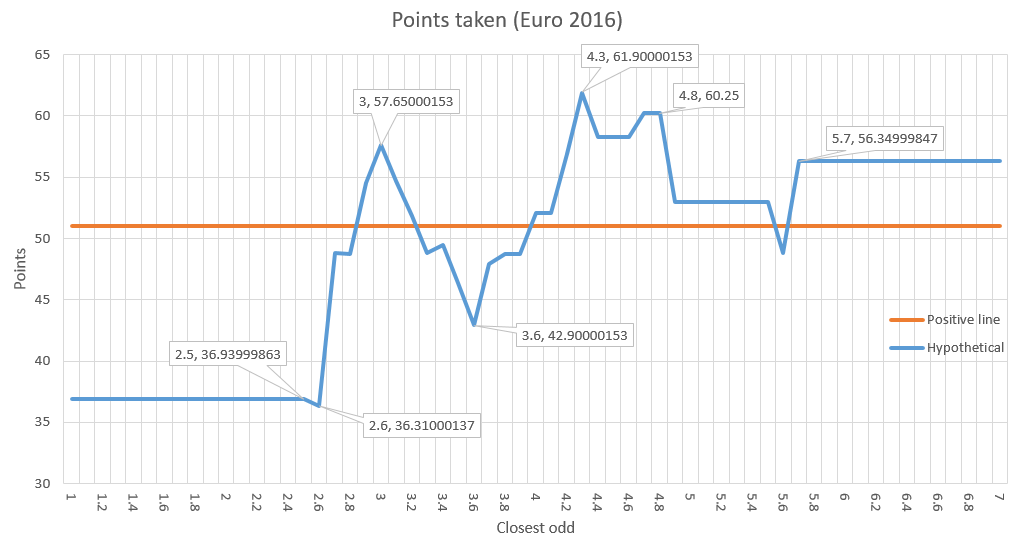
This is exactly my train of thought how I ended up with following analysis. Imagine if we said we want to bet only on odd Y. Now, when you have 3 odds for 1, X, 2, usually none of them will be equal Y. However, some of them will be closer to Y than others. So, what I did is generated hypothetical achieved points, based on all possible odd values Y. Here is simple example, imagine if Y is 4.5. If you have odds 1.1, 4.2 and 5.0, you would bet on 4.2, as it is closest to 4.5. Note that this approach is generalization of minimum/maximum question that everyone is asking about (if we put Y to be low (1.0) or really high (10.0), it is the same as if you bet on minimum or maximum odd, respectively). So, let’s plot now how our points would change based on odd we want to bet:
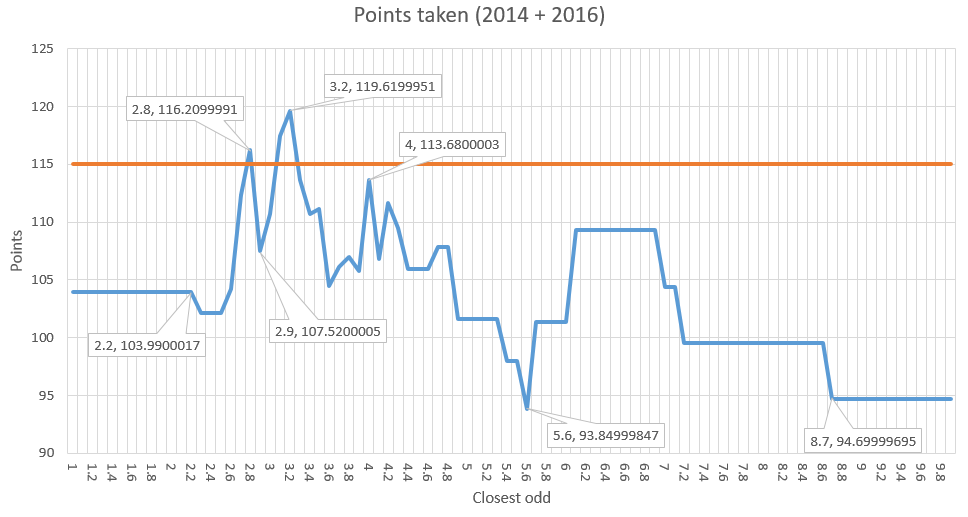
On X-axis is odd we want to bet as closely as possible. On Y-axis are hypothetical amount of points if you would bet on those odds. Orange line is equal to number of matches and is boundary to being positive/negative on betting. I also added couple of callout values, so it is easier to see where hills/dips are. Obviously, data sample is very small and there is no statistical significance here. Only thing left (other than adding odds from Euro2012 etc. which I do not plan to do) is to sum those two competition and treat it as bigger one. For example, around odd values 3.x and 4.x are some small hills on both competitions, and my guess was they will be exaggerated on summed:
Well, this does makes more sense to me overall:
- You are rarely positive (above orange line) and I can argue this is just a statistical error
- Minimum and maximum are leveling to be same
- There are some peaks and dips around 3 and 4
Conclusion
C’mon, you didn’t really believed there is something under the data that will help you win big time?:) With more data (more competition), my take is that this line will flatten itself. This makes sense as odds are nothing but probabilities, and be it 1.01 or 10.0, if you play long enough exact same odd, you will be (almost) at zero. However, if you want to minimize your risk, maybe, just maybe, try playing odds around 3.2 and 4.0 (but avoid odd 3.6 as much as you can:)


[…] ako vam se sviđaju ove moje debilne analize sa ovako random temama, onda će vam se sigurno svidi i datatata blog od mog kolege:) Sad kad sam […]